
Researchers have established an artificial intelligence benchmark to quantify the progression of idiopathic pulmonary fibrosis as the lungs stiffen, helping clinicians gauge how the disease is likely to evolve.
A joint research team led by Choi Ju-ae of the Department of Radiology and Kim Ho-chul of the Division of Pulmonology at Seoul Asan Medical Center, alongside Lee Ho-yeon of the Department of Radiology at Samsung Medical Center, announced on the 3rd that AI analysis of chest computed tomography (CT) images identified a critical cutoff: a lung fibrosis score increase of 4.05 percentage points or more over one year signals a significantly higher risk of death or needing a lung transplant. The findings were published in the online edition of the American Journal of Respiratory and Critical Care Medicine on May 24.
The team first identified the threshold using patient data from Seoul Asan Medical Center and then tested whether the same benchmark applied to patients at Samsung Medical Center, analyzing retrospective medical records.
Changes Lung Function Tests Can Miss, Confirmed on CT
Idiopathic pulmonary fibrosis is a condition in which normal lung tissue turns into scar-like tissue without a clear cause. "Idiopathic" indicates an unknown cause, while "fibrosis" refers to tissue that was once soft becoming thicker and stiffer.
As the disease advances, the lungs grow rigid, making it difficult to take deep breaths and reducing their ability to transfer oxygen into the bloodstream. Because damaged tissue cannot be restored to its original state, identifying the pace of progression early is critical.
Clinicians currently track disease progression primarily through pulmonary function tests. Forced vital capacity measures the volume of air a person can forcefully exhale after inhaling as deeply as possible, while the diffusing capacity of the lung for carbon monoxide test measures how efficiently the lungs transfer gases like oxygen into the blood.
Both tests assess functional changes across the lungs as a whole, but they cannot determine precisely which areas have stiffened or by how much. Furthermore, test results can fluctuate depending on a patient's breathing condition and level of cooperation at the time of testing.
CT imaging allows doctors to inspect the lungs directly, but subtle changes are difficult for medical staff to compare by eye alone. Visual assessments vary by reader, making it hard to quantify exactly how much the stiffened area has expanded compared to the previous year.
Fibrosis Score Calculated by Combining Reticular and Honeycombing Changes
Using AI software, the research team automatically calculated the extent of "reticular opacity" and "honeycombing" on CT scans. Reticular opacity appears on CT as thin lines interwoven like a net, while honeycombing describes severely damaged lungs where small air spaces cluster in multiple layers. Combining the proportions of these two findings across the entire lung yielded a single "fibrosis score."
The team first analyzed data from 524 patients diagnosed with idiopathic pulmonary fibrosis at Seoul Asan Medical Center who underwent both CT imaging and pulmonary function tests at an initial examination and a follow-up about one year later.
The researchers then applied the same threshold to 224 Samsung Medical Center patients meeting the same criteria to verify whether a benchmark established at one hospital held true for another.
Comparing initial CT scans with follow-up images taken one year later for all 748 patients, the researchers found that as the fibrosis score rose, pulmonary function test results consistently deteriorated.
When forced vital capacity dropped by 5%, the fibrosis score increased by an average of 2.72 percentage points. When diffusing capacity for carbon monoxide dropped by 10%, the score rose by an average of 4.52 percentage points.
A 4.05%p Rise in a Year Linked to 2.78 Times Higher Risk of Death or Transplant
The benchmark that best identified the risk of death or lung transplant was 4.05 percentage points. Patients whose fibrosis score increased by at least that amount over one year compared to their initial exam faced a higher risk of death or requiring a transplant.
The same pattern was confirmed in the Samsung Medical Center cohort. Even after controlling for variables such as age, sex, and baseline lung function, patients with a fibrosis score increase of 4.05 percentage points or more had a 2.78-times higher risk of death or lung transplant. When limiting the observation period to three years, the risk ratio reached 2.88.
This figure does not mean an individual patient's absolute probability of death increases by 2.78 times; rather, it indicates that the relative rate of death or lung transplant during the study period was that much faster.
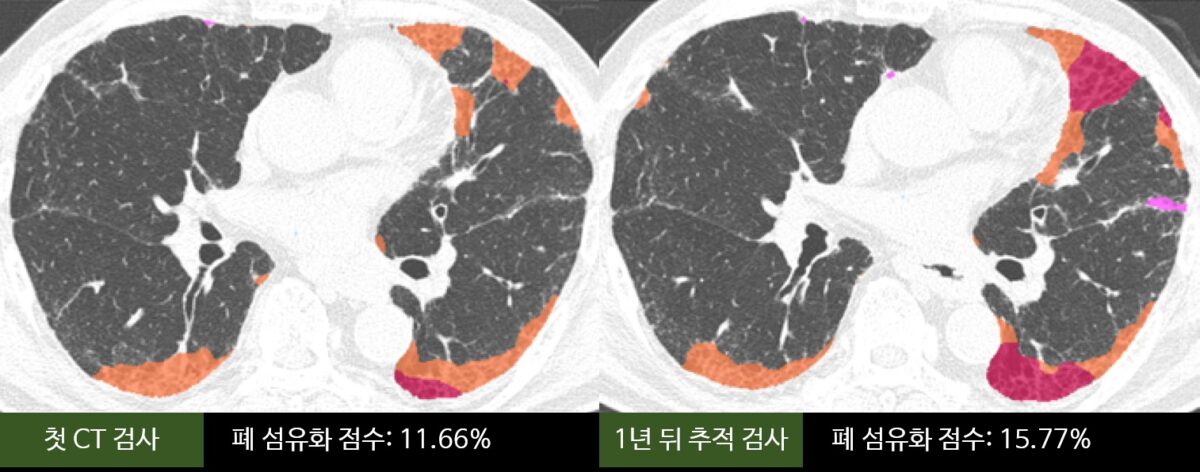
A 75-year-old patient detailed in the study saw their fibrosis score increase from 11.66% to 15.77% over one year, alongside concurrent declines in lung volume and diffusing capacity.
Adding the initial CT fibrosis score and its one-year rate of change to existing prognostic models based on age, sex, and lung function significantly improved the ability to identify high-risk patients.
In this way, AI analysis provides a valuable supplementary indicator by converting subtle imaging changes that are hard to capture through pulmonary function tests alone into precise numerical values.

Too Soon to Base Treatment Decisions on the Fibrosis Score Alone
Despite these findings, it is too early to use the 4.05-percentage-point cutoff as an immediate trigger to alter treatment. The study was an observational analysis of past medical records, and the validation cohort at the second hospital comprised 224 patients. Additional research is necessary to determine whether the same threshold applies across different CT equipment, imaging protocols, or AI software.
The study also does not justify annual CT scans for all patients, as repeated imaging exposes individuals to cumulative radiation.
Clinicians should not modify treatment strategies based on the fibrosis score alone. Instead, they should evaluate the score alongside lung function, symptoms, blood oxygen saturation levels, and overall CT changes.
Patients can ask their physicians in the exam room by how many percentage points their fibrosis score has changed compared to last year. It is also important to verify whether both CT scans were conducted under similar conditions and whether lung function moved in the same direction.
"This study presented a cutoff for clinically meaningful changes in the fibrosis score, showing that quantitative CT analysis can serve as a supplementary indicator in regular follow-up monitoring and treatment planning for idiopathic pulmonary fibrosis," Choi said.
"Because damaged lung tissue cannot recover once idiopathic pulmonary fibrosis sets in, early diagnosis and treatment are extremely important," Kim said. "This study is meaningful in that it established a standard for objectively evaluating disease progression and confirmed its potential as an imaging biomarker to verify treatment efficacy in future clinical trials."
An imaging biomarker refers to an indicator that quantifies visual changes on CT or magnetic resonance imaging (MRI) scans to assess disease progression or treatment response.